EN

Belt Discharge Trajectory Calculator

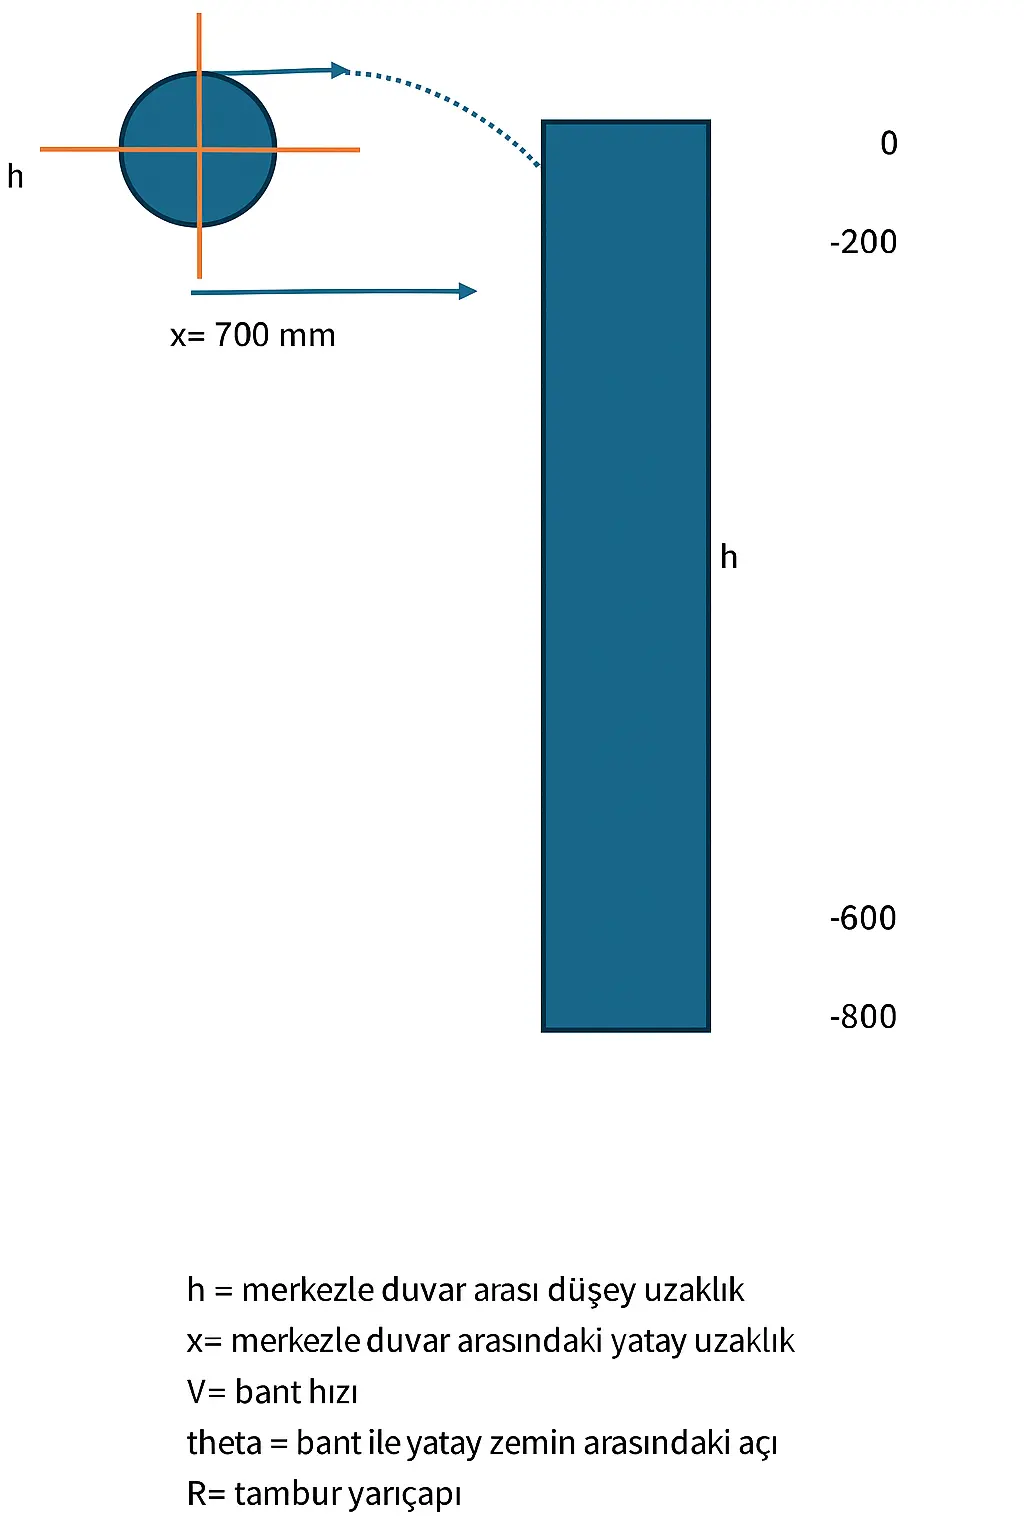
Pulley Diagram

MEKA Conveyor Trajectory Curves

The "flight" behavior of stone leaving the belt, made visual and easy to understand

Understanding the material flow at the conveyor discharge point is critical for spillage, dust generation, wear and directing the stone to its target. The MEKA Conveyor Trajectory Curves Tool presents the visual trajectory curves of the material leaving the belt within seconds. With an interface that accounts for pulley/roller geometry, belt speed, horizontal distance and site-specific conditions, speed up your transfer point and chute entry zone design decisions.

Why this tool?
Fast visualization: Compare different scenarios with a single click; shorten your design cycle.

Site-appropriate modeling: Handles pulley radius, belt speed, horizontal distance (X) and site-specific drop conditions.

Cleaner transfer: Helps reduce spillage and misalignment, aiming to extend maintenance intervals.

Operational insight: Clarifies different use cases such as crusher/hopper feeding, transfer to a secondary conveyor and stockpile feeding.

Secure approach: The calculation logic is MEKA's intellectual property; formulas are not shown.
Who uses it?
Aggregate and mining operations: Efficiency and cleanliness at transfer points

Ready-mix concrete and cement: Dust and spillage control with dry materials

Engineering and EPC teams: A quick reference for preliminary design and scoping

Maintenance teams: Improvement areas to reduce wear and cleaning workload
Key features
Intuitive interface: Selection of pulley radius (D), belt speed (V), horizontal distance (X) and a site-specific drop condition.

Multi-scenario tracking: View different X variants on a single screen and compare curve sets.

Clear visuals: Clean charts that field teams can read easily.

Mobile-friendly experience: Quick checks on a phone/tablet at the job site.

Note: The tool is intended for preliminary design and planning; final layouts must be verified with on-site measurements and operating data.
Use cases
Defining the chute entry profile: reducing bottlenecks and bounce-back

Crusher feeding: checking its alignment

Transfer to a second conveyor: keeping the drop line aligned with the roller/idler arrangement

Stockpile feeding: directing the landing point to the desired spot on the pile

Dust and spillage control: improving the placement of covers, seals and suction inlets
How it works?
1. Select the D, V and X values that match your conveyor/discharge configuration.

2. Check the drop condition if a site-specific one is required (e.g. a certain drop-height threshold).

3. Click Show chart to visualize the trajectory curves.

4. Compare scenarios to decide on the placement of transfer and protection components.
Try it now
Take the first step toward a clean, controlled and safe flow at the transfer point. Contact us for a live demo or a quote.

Frequently Asked Questions (FAQ)

What is a trajectory curve and why does it matter?

It visualizes the path that material follows through the air after leaving the belt. A correct trajectory helps reduce spillage and wear, and helps feed the target equipment (crusher, chute, conveyor) accurately.

How should the tool's accuracy be assessed?

The results depend on site-specific material and equipment conditions. The tool is therefore intended for preliminary design; for critical decisions, verification with site data is recommended.

Which inputs are required?

Parameters such as pulley/roller geometry, belt speed and horizontal distance; where needed, a check tied to specific drop conditions.

Which sectors is it suitable for?

Aggregate, mining, cement, ready-mix concrete, port/logistics and EPC projects.